To answer to this question, you need to understand what the energy flexibility is. Nevertheless for that, please refer to previous article here, where we explained more extensively the topic.
In a few words, the #energyflexibility is the capacity of a consumer to control the #consumption and reduce or increase it to compensate #grid peaks.
So, as a #consumer, your business-as-usual activity requires to consume #energyresources.
The combination of those resources determines your #demand: you can see it in a graph below in terms of energy versus time.
From that demand curve, we can extract raw information about your potential energy flexibility through our #ML algorithms.
The outcome is:
- the flexibility throughout the day, with a statistic analysis, by day hours,
- the potential income in the case you will sell it to the market,
- under the assumption that the market pays you off with a certain price.
So, in simple terms, it displays your earnings from controlling and reducing your consumption in certain moments.
Since the analysis is statistic, it doesn’t mean you need to deal with it in absolute terms. Rather, this displays the potential benefits coming out from your participation in the #balance #service #markets.
How to get this information?
You can use a free of charge tool for flexibility-as-a-service: here is the link.
Requirements
Since this is for invitation, you need to request the credential (usually the account name is your business mail and the password will be sent our via email).

You need to prepare your historical consumption file from your metering during at least 1 month.
In the header, you have the minimum recommendations to pass the file checks.
You can also get a template file from the link Download Sample CSV. CSV is the most suitable file format for the analysis.
How to use it?
Once you logged in, you need to upload the consumption file, in Choose file.
So, the system checks its format and if it is correct allows you to proceed on.
Then you need to select which industry (Select a category …) you work in.
Finally, press on Upload.
It usually takes 1 minute or less to upload and display the graph as in the previous image.
How to read the output?
The analysis points out where you can implement some optimisation mechanisms to control the consumption in either red and green areas.
Usually, in red, the system highlights the potential that you can shave in peak moments or through load shedding.
In green, this is the potential flexibility to leverage to compensate either grid peaks and your peaks throughout the day (load shimmying).
With the combination of the two measurements, you can determine how many energy to control and sell to the balance service market.
The tool does not pretend to be an exhaustive analysis.
Rather to unfold the potentiality of your consumption and which assets are hidden.
How much?
The system determines how much energy flexibility on average you can get throughout the day and what its economic value will be.
The first output is a raw estimation.
The second data is obtained from the market price: you can play with the sliding bar to get the economic value out, under the assumption of the market price.
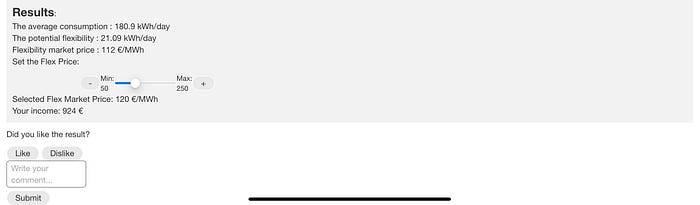
Does it work for you?
The tool is designed to provide a raw idea of your potential flexibility.
Nevertheless, it requires improvements and a deeper analysis of your specific business-as-usual.
For the latter, BeChained will be at your disposal to study case by case. And provide a tailor-made outcome.
For this reason, we added a feedback box where you can either request support, (hopefully positive) comments and then Submit them.